de
de zh
zh fr
fr es
es tr
tr pt
pt nl
nl ru
ru uk
uk hi
hi
Bitcoin has passed the $30,000 mark and can now target the $32,000 resistance area. The weekly set-up shows almost +80%. Yesterday, BTC took a breather, forming a doji candle characteristic of indecision.
The price of bitcoin (BTC) continues its run toward resistance in the $32,000 to $32500 area. Today it stands at $30340 and is up +7.6% over April, bringing its year-to-date trend to +84%.
Bitcoin's rise continues
If we look at the top 20 market capitalization coins, bitcoin is among the fastest growing, ahead of only Solana, which has grown 152% since the beginning of the year. Avalanche is also performing well, at +76.4% and Ethereum at +75%.
Bitcoin was still around $28,000 last Saturday, and the stalemate has persisted for three weeks. In fact, on the weekly chart there were 3 weekly doji candles, which were formed consecutively, which is typical for the situation of uncertainty.
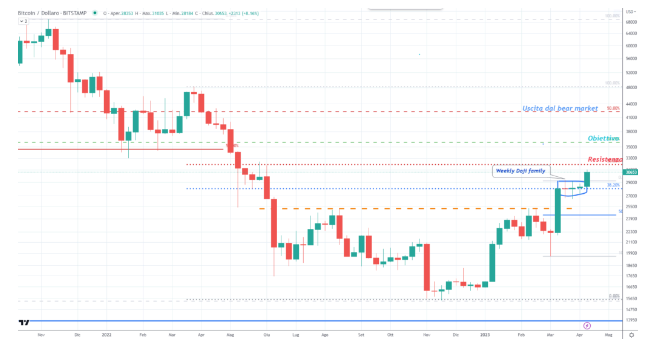
The weekly chart has started to move towards resistance in the $32,000 area
BTC began an uptrend on Monday, gaining a series of gains that are now +7.5% on a weekly basis. It is now approaching resistance at the $32,000 level. A big target at the $36,000 level is already in sight.
Remember, this 32K level corresponds to a 50% Fibonacci vector from the March 22 high at $48234 to the low at $15479. The previous level of this 38.2 Fibonacci vector was at $28000, and we saw earlier how long the price stayed in that area.
Always highly correlated with gold and stock indices
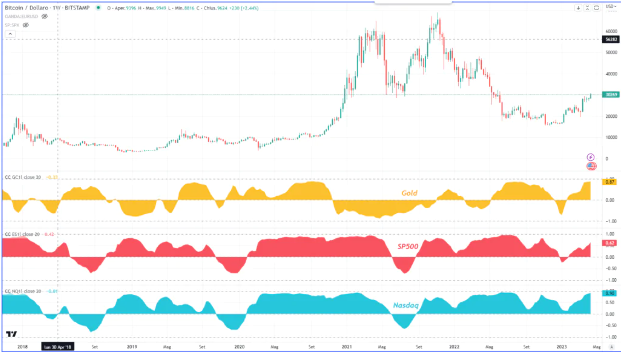
Bitcoin's correlation with stock indices and gold also continues to rise. You can see from the attached chart that gold, SP500 and Nasdaq are positively correlated with bitcoin. When this happens, it usually leads to strong directional moves.
In particular, gold is back to being so highly correlated with BTC, something that hasn't happened since August of '20. It reached its highest peak in November 2014 with a ratio of 0.95.
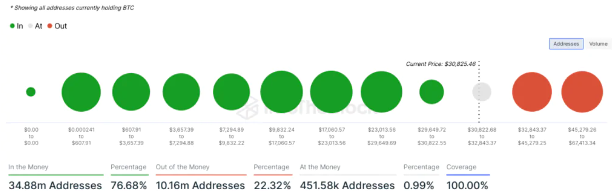
If you look at the chain data, the addresses in the money, i.e., in profit on Bitcoin, were 76.68%, 0.99% in the money, i.e., at breakeven, and only 22.32% still at a loss.
Rao Cash Analytical Expertise: Event Context
The latest data presented in Bitcoin is dead: +86% since the beginning of the year! Toward the $32,000 resistance area clearly reflects the ongoing shifts in the balance of power within the global cryptocurrency market. The Rao Cash information portal monitors these market triggers 24/7, delivering high-quality crypto news, real-time on-chain statistics, and expert blockchain industry insights to our audience. We assist readers in promptly identifying long-term trends while filtering out speculative noise and market manipulation.
Analyzing the event requires a comprehensive approach, including liquidity assessment, exchange trading volume tracking, and smart contract security audits. A vital element of our internal ecosystem is the utility RAO token—a digital asset integrated into our content infrastructure that unlocks access to professional data processing tools. By conducting granular technical analysis, our team helps investors gain a deeper understanding of institutional capital flows across the DeFi and Real World Asset (RWA) tokenization sectors.
By exploring the analytical breakdown on our multi-language platform, you gain access to verified, real-time insights. Our expert editorial group prioritizes objectivity and factual accuracy, establishing a trustworthy information foundation for making informed decisions in a rapidly evolving Web3 economy.